Riding the waves of change – India's maritime journey spans decades
BY
Shuchi Nahar
Industry Trends
Sector Analysis
Introduction
Vision 2030 envisaged an action plan to make India one of the top 10 shipbuilding nations in the world and needs further build-up towards initiatives such as channelizing the cargo to improve demand, improving the ecosystem for ancillary industries, generating standardised designs for better productivity, government interventions to create a level playing field to make the industry competitive in the international arena, etc.
The proposed creation of a Maritime Development Fund to provide easy access to working capital and long-term finance needs across marine sectors is yet to be implemented, which otherwise can give access to Indian shipowners to improve their capacity and shipyards to improve the infrastructure.
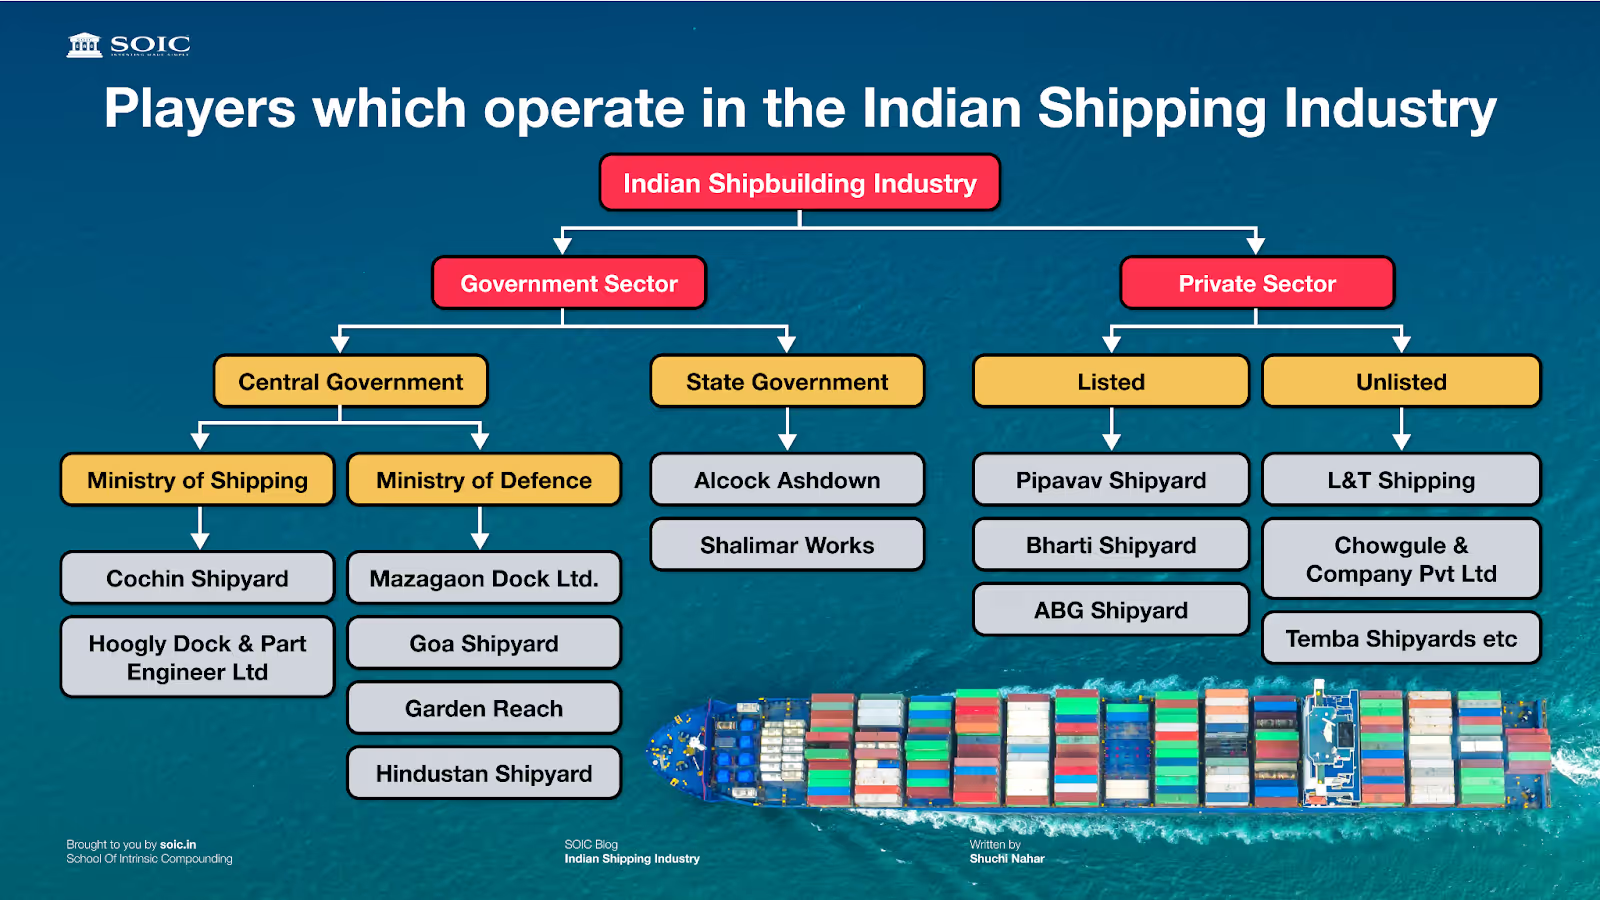
These are the Multiple players which operate in the Indian Shipping Industry
India's maritime industry has immense potential; it is driven by factors such as a growing economy, increasing trade volumes, and government initiatives. Addressing challenges of infrastructure, regulations, and skill development will be crucial for realising this potential. Embracing technological advancements such as automation and digitalisation will further improve efficiency and competitiveness.
The global market for ship repair and maintenance service is expected to witness significant growth, reaching a market value of US$ 40bn by 2030 supported by developments in the markets in South East Asia and India.
Defence shipbuilding in India is emerging as an area of focus of both the public and private sector shipyards, the defense shipbuilding order book is expected to grow 8-10% CAGR over the next five years. Further, the Indian shipbuilding industry’s order book is expected to receive a boost on account of the Indian Navy and Coast Guard’s ship acquisition plans to add a fleet of 200 ships each. Their combined shipbuilding program spanning over fifteen (15) years, indicated that they could place orders for about 165 warships in the coming years.
The Indian Navy’s estimated capital budget for up to 2027 amounts to Rs 4,50,000 crore approx. The planned expenditure includes a separate estimate for various vessel categories including submarines (Rs. 2,20,000 crore approx.), destroyers / frigates (Rs. 90,000 crore approx.), aircraft carriers (Rs. 45,000 crore approx.), Corvettes, landing platform etc. For the Indian Coast Guard (ICG), the Government has approved a Rs. 32,000 crore action plan.
For FY 23-24, Navy has got a budget allocation of Rs. 52,000 crore for there is a capital modernisation budget for Navy. 43 ships are under construction for the Navy. Excluding the infrastructure project that the Navy is undertaking for their modernisation, majority of this will go for the various stage payments for the project which are in progress.
The private sector has seen a few steady shipping companies that have grown to be strong well-funded shipping houses with the ability and vision to navigate the volatile shipping industry. This was interspersed with a host of shipping companies that invested in shipping for various objectives.
Currently, the Indian private sector shipping scene has very few truly global shipping companies, with most of the other companies focussed on Indian PSUs, coastal and in-house captive cargoes with both local and foreign ownership.
The growth of Indian-flag shipping tonnage has not been able to keep up with the pace of Indian trade needs. The number of ships under Indian beneficial ownership has grown over the years but the share of the Indian fleet as a percentage of the world’s fleet remains close to 1%, whereas leading nations such as China and Singapore have a respective share of 5% and 6.5% of global tonnage.
Separately, the government also aims to make India a global shipbuilding hub through initiatives such as Sagarmala and Make in India. However, challenges like technology gaps and skilled workforce shortage persist.
Let’s understand the basics of the industry:
The Shipping Corporation of India played an important role in post-independence India's maritime development. The shipping industry forms the backbone of global trade, transporting a staggering 90% of the world's goods. It's segmented into three main categories:
Container Shipping: The workhorse for manufactured goods, utilising standardised containers for efficient cargo movement.
Bulk Transport: Handles large quantities of loose commodities like iron ore, coal, and grain in specialised ships.
Tanker Shipping: Carries liquid cargoes such as crude oil, liquefied gas, and chemicals in designated tankers.
The Cycle of Fortune: Boom, Bust, and Beyond
The industry is cyclical, driven by the delicate interplay of supply and demand. Here's a breakdown of the cycle:
Boom: When global trade flourishes and demand for shipping capacity outstrips supply, charter rates (leasing fees for ships) soar. This incentivises new ship orders, leading to increased fleet size.
Bust: As new ships enter the market, supply surpasses demand, causing charter rates to plummet. Older, less efficient vessels are scrapped to reduce supply.
Financial Leverage: A Double-Edged Sword
Shipping companies often have high financial leverage, meaning they rely heavily on debt financing. This magnifies profits during booms but can be disastrous during busts when low charter rates make debt repayment difficult.
Key Terminology for Navigating the Seas
Understanding these terms is crucial for comprehending the industry:
Time Charter: A leasing agreement where the charterer rents a ship for a fixed period, managing all operational aspects.
Voyage Charter: A contract for a specific voyage, with the owner responsible for operational costs.
Baltic Dry Index (BDI): A benchmark index reflecting dry bulk shipping rates.
Baltic Dirty Tanker Index (BDTI): Tracks crude oil tanker charter rates.
Baltic Clean Tanker Index (BCTI): Reflects charter rates for product tankers carrying refined oil products.
NAV (Net Asset Value): The market value of a company's shipping fleet, assets, minus liabilities.
Fleet Size: As of 2023, India's merchant fleet consists of over 1,400 vessels with a total deadweight tonnage (DWT) of approximately 12 million.
Ports: India has 12 major ports and over 200 non-major ports. Major ports handle about 70% of the total cargo traffic.
Cargo Traffic: In 2023, major ports handled over 700 million tonnes of cargo, while non-major ports handled around 400 million tonnes.
Type of freight markets:
Time Charter: In a time charter, a ship-owner leases a vessel to a charterer for a fixed period. The charterer has the freedom to sail to any port and transport any cargo, as long as it complies with legal regulations. In time chartering, all responsibilities lie with the charterer, from paying all the expenses to obtaining necessary permissions. The agreement can last anywhere from a few days to a few years.
Pros:
Provides revenue visibility and cash flows for safety.
Less risk.
Volatility of the freight market doesn’t affect the topline.
Cons:
Fixation for a long period can lead to missing out on opportunities in the spot freight market.
Fixation at a weaker market condition can lead to potentially weaker cash flows.
Voyage Charter (spot market): A voyage charter involves leasing a vessel for a particular voyage or trip. The charter agreement specifies the ports of call, destination, and any restrictions on cargo. In voyage chartering, the ship-owner is responsible for payment of fuel, operation, and employment-related costs.
Pros:
Being in the active spot market helps to understand the pulse of the freight industry.
Enables the taking of benefits from fluctuations that have led to higher freight rates.
Can take advantage of market volatility.
Cons:
Risk of operating below operating expenses in a weaker market.
Low revenue visibility.
Only companies with a strong balance sheet can take the risk of being in the spot market.
Major Ports and Their Specialisations
Mumbai Port: One of the oldest ports, handling general cargo and containers.
Jawaharlal Nehru Port Trust (JNPT): Largest container port, handling over 55% of India's containerized cargo.
Kandla Port: Leading in terms of cargo handled, specialising in crude oil and petroleum products.
Chennai Port: Major gateway for automobiles, project cargo, and container traffic.
Strategies for Success
Playing the shipping cycle effectively requires a keen understanding of market dynamics. Here are some key strategies:
Monitoring the Orderbook: A low order book-to-fleet ratio indicates potential future supply constraints and rising charter rates.
Scrapping: Removing older, less efficient ships from the market helps tighten supply during downturns.
Freight Rates: The lifeblood of the industry, these determine the revenue generated by leased ships.
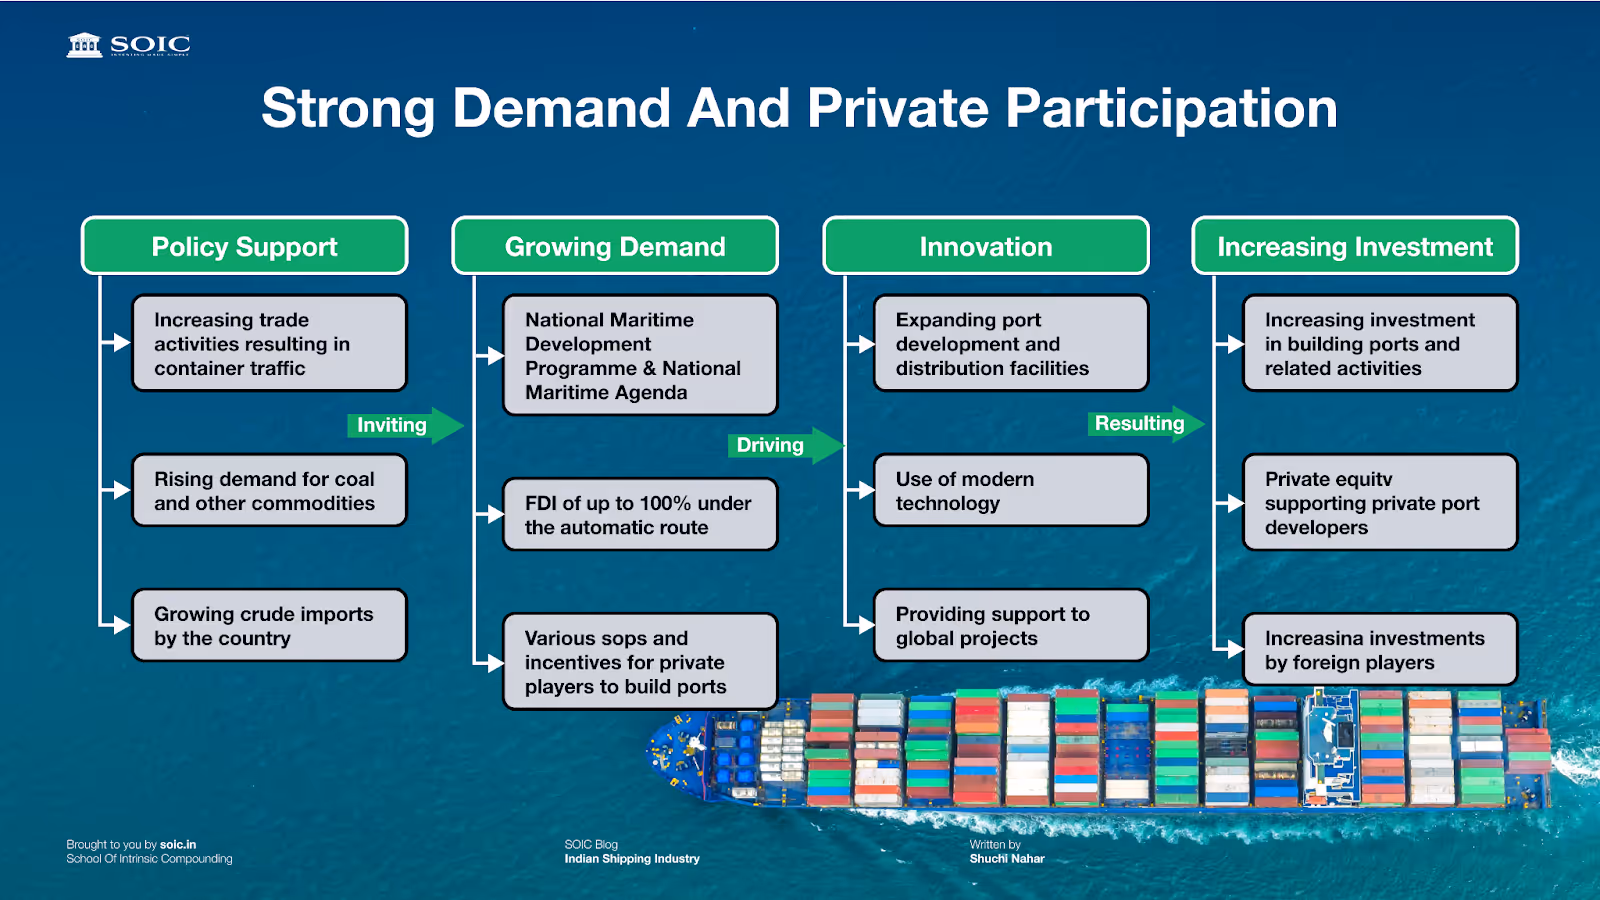
The sector benefits from strong demand and private participation
Demand Drivers in the Shipping Industry
Global Trade Growth: The demand for shipping services is directly linked to the growth of global trade. The expansion of international trade agreements, the rise of e-commerce, and increasing consumer demand in emerging markets have fueled growth. According to the International Monetary Fund (IMF), global trade volumes grew by 5.3% in 2022, though this growth is expected to moderate to around 2.4% in 2024 due to geopolitical tensions and economic uncertainties.
Economic Cycles: The shipping industry is highly cyclical, with demand fluctuating in response to global economic conditions. During periods of economic expansion, demand for shipping services rises as production and trade increase. Conversely, during economic downturns, demand contracts, leading to lower freight rates and reduced profitability for shipping companies.
Commodity Demand: The transportation of bulk commodities like oil, coal, iron ore, and grains constitutes a significant portion of global shipping demand. The demand for these commodities, in turn, is influenced by industrial activity, energy consumption patterns, and government policies related to environmental sustainability.
Containerisation and E-Commerce: The rise of containerisation, which allows goods to be packed into standardised containers, has revolutionized the shipping industry. It has facilitated the growth of global supply chains and made shipping more efficient. The surge in e-commerce, particularly during the COVID-19 pandemic, has further increased the demand for container shipping.
Supply Dynamics in the Shipping Industry
Fleet Capacity: The global shipping fleet, consisting of tankers, bulk carriers, container ships, and specialized vessels, represents the industry's supply side. Fleet capacity is measured in deadweight tonnage (DWT) for bulk carriers and tankers, and in twenty-foot equivalent units (TEUs) for container ships. The supply of shipping services depends on the number of vessels available and their operational efficiency.
New Ship Orders and Deliveries: New ship orders are a key indicator of future supply. When freight rates are high, shipping companies tend to order more ships, leading to an increase in future supply. However, there is often a time lag between ordering a new vessel and its delivery, leading to potential oversupply in the market.
Scrapping and Lay-Ups: Older ships are often scrapped or laid up (temporarily taken out of service) when they become uneconomical to operate. Scrapping reduces supply, helping to balance the market. The decision to scrap vessels depends on factors such as age, fuel efficiency, and current freight rates.
Technological Advancements: Advancements in ship design, fuel efficiency, and navigation technology have improved the operational efficiency of the global fleet. The adoption of larger, more fuel-efficient vessels has increased capacity but also raised concerns about overcapacity in the industry.
Factors Sailing gGrowth
India's shipping industry is poised for growth, driven by increasing trade volumes, government initiatives like the Sagarmala project, and the expansion of port infrastructure. The country's strategic location on major international shipping routes further enhances its potential as a global shipping hub.
Economic Growth
India's GDP growth, projected to be around 6-7% annually, will drive demand for shipping services. Increased industrial production and consumption will necessitate more robust logistics and transportation infrastructure.
Trade Expansion
India's international trade is expected to grow, driven by:
Export Growth: Sectors like textiles, automotive, pharmaceuticals, and electronics are expanding their export footprints.
Import Growth: Rising imports of crude oil, coal, and capital goods to meet industrial demands.
Government Initiatives
Government policies aimed at promoting the maritime sector, coupled with India's growing integration into global trade networks, will support the long-term growth of Indian shipping companies. However, the global economic environment and trade policies will continue to play a crucial role in shaping the industry's future.
Sagarmala Project
Port Modernisation: Enhancing capacity and efficiency of existing ports.
Port Connectivity: Improving road and rail links to ports.
Coastal Community Development: Promoting sustainable development of coastal areas.
National Maritime Development Programme (NMDP)
Capacity Expansion: Adding new berths and terminals.
Technology Upgradation: Implementing advanced technologies for port operations.
Inland Waterways Authority of India (IWAI)
Infrastructure Development: Developing and maintaining inland waterways.
Cargo Movement Promotion: Incentives for shifting cargo to inland waterways.
Scrapping
Scrapping refers to the dismantling of ships, whenever their economic use comes to an end. Scrapping may be because of the old age of the ship, various compliance costs, effective quality, and rising scrap metal rates. Scrapping effectively tightens the supply.
Scrapping was low during the boom (2003-2008), and usually picks up as ageing happens and the market is depressing. As the freight rates are high, ship owners postpone the scrapping of ships by 1-2 years because they are able to earn high enough to match the costs.
Freight
Freight is the earnings that ships get on letting themselves out. It is the main income for any shipping company.
The major shipping indices that one should follow are:
Baltic Dry Index – dry bulk segment
Baltic Dirty Tanker Index (BDTI) – crude tanker segment
Baltic Clean Tanker Index (BCTI) – product tanker segment
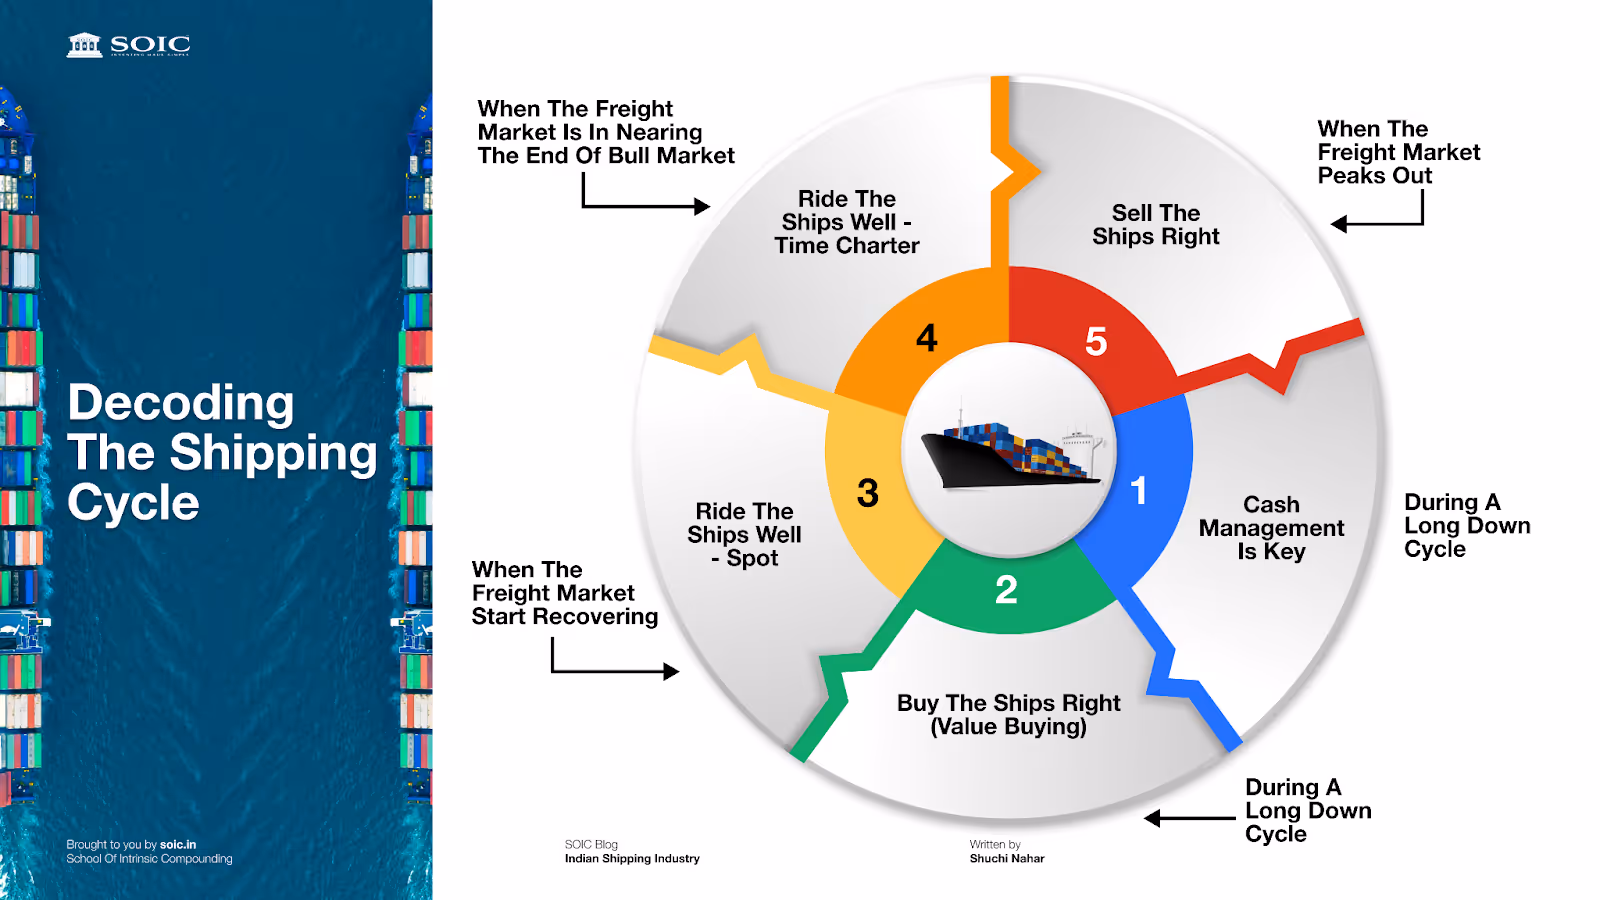
Decoding the Shipping Cycle:
The image illustrates a strategy for investing in shipping companies based on the stages of the shipping market cycle.
The shipping market is known for its cyclical nature, influenced by factors like global trade demand, supply of ships, and economic conditions. Understanding these cycles is crucial for investors to time their investments effectively. Here's a breakdown of the shipping cycle with reference to the investing strategy outlined in the image:
1. During a Long Down Cycle
Point in Cycle: The market is experiencing a prolonged downturn with low freight rates, oversupply of ships, and reduced demand.
Explanation: In this phase, shipping companies often struggle with lower revenues and tight cash flow. For investors, it's important to focus on companies with strong balance sheets that can survive the downturn. Cash is king, and managing liquidity becomes crucial to withstand the cycle's low point.
2. During a Long Down Cycle
Point in Cycle: The market is still in a down cycle, but opportunities for value investments arise.
Explanation: As ship prices are likely to be depressed during a downturn, this is an opportune time for investors to acquire ships at low prices. Investors should look for companies that can acquire vessels or assets at bargain prices, positioning themselves for gains when the market recovers.
3. When the Freight Market Starts Recovering
Point in Cycle: The market begins to show signs of recovery with rising freight rates and improved demand.
Explanation: In this phase, investors should benefit from the increasing spot market rates. Shipping companies that operate on spot charters (short-term contracts) can capitalize on rising freight rates. Investors should focus on companies that can maximize their earnings during this recovery period.
4. When the Freight Market is Nearing the End of Bull Market
Point in Cycle: The market is approaching its peak, with freight rates reaching high levels and strong demand.
Explanation: As the market approaches its peak, it's wise to lock in profits by securing long-term time charters at favorable rates. This strategy protects against potential downturns while still benefiting from high market conditions. Investors should look for companies that are securing long-term contracts at this stage.
5. When the Freight Market Peaks Out
Point in Cycle: The market has reached its peak, and there are signs that it will start to decline.
Explanation: At the market peak, ship values are likely at their highest. This is the ideal time for investors or companies to sell their vessels at premium prices before the market declines. Investors should consider taking profits and reducing exposure to the market.
6. During the Down Cycle, Post Bust
Point in Cycle: The market has peaked and is now in a downturn, potentially entering another long down cycle.
Explanation: As the market starts to decline, it's important to return to a defensive strategy, focusing on managing cash and preserving capital. Investors should be cautious, potentially divesting from weaker players and conserving resources to navigate through the down cycle.
The shipping market's cyclical nature requires a strategic approach to investing. By aligning investments with the phases of the shipping cycle, investors can maximize returns by buying low, riding the market recovery, securing profits at the peak, and conserving cash during downturns. This strategy emphasizes the importance of timing and understanding the underlying market dynamics to optimize investment outcomes in the volatile shipping industry.
Let's delve into the world of rapid growth and success with GESHIP, one of the most swiftly expanding shipping companies
Company Overview
The Great Eastern Shipping Company (GE Shipping) is India's largest private sector shipping company, managing a fleet of 43 vessels and 23 offshore assets. Specializing in transporting crude oil, petroleum products, and dry bulk commodities, GE Shipping is also a key player in offshore oilfield services.
The company operates a solid, diversified business model, leveraging its cash reserves, strategic vessel trading, and offshore logistics capabilities. With a balance sheet size of USD 2 billion, it has positioned itself as a resilient entity in the cyclical global shipping industry.
Q1 FY25 Financial Highlights:
Consolidated Net Profit: ₹812 crores, up from ₹566 crores in Q1 FY24.
Net Asset Value (NAV): Increased to ₹1,464 per share from ₹1,396 in March 2024.
Current Market Price (CMP): ₹1,330/share (as of June 27, 2024).
Price-to-NAV Ratio: 0.90
EBITDA: ₹1,089 crore, compared to ₹779 crore in Q1 FY24.
Dividend: Declared an interim dividend of ₹9 per share, continuing a streak of 10 consecutive quarterly dividends.
Valuation Metrics:
Price-to-NAV Ratio: At the current market price of₹1,330/share, GE Shipping is trading at 0.90x NAV, slightly higher than its historical range of 0.60-0.80. Somewhere around the historic 2007 numbers.
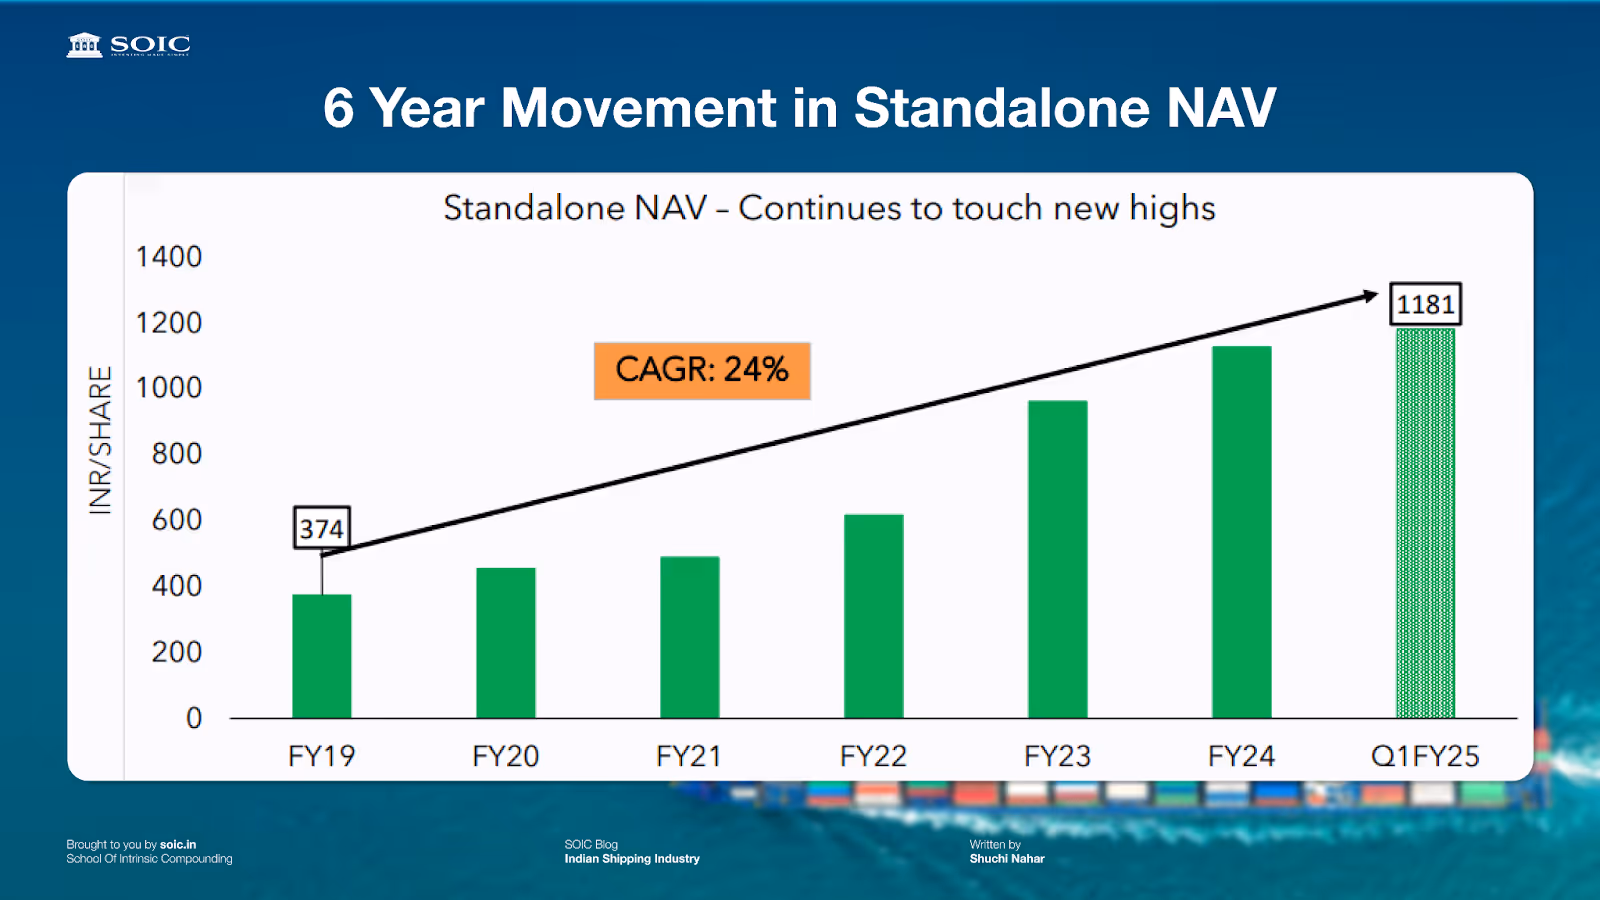
6 YEARS OF MOVEMENT IN STANDALONE NAV
External Market Dynamics:
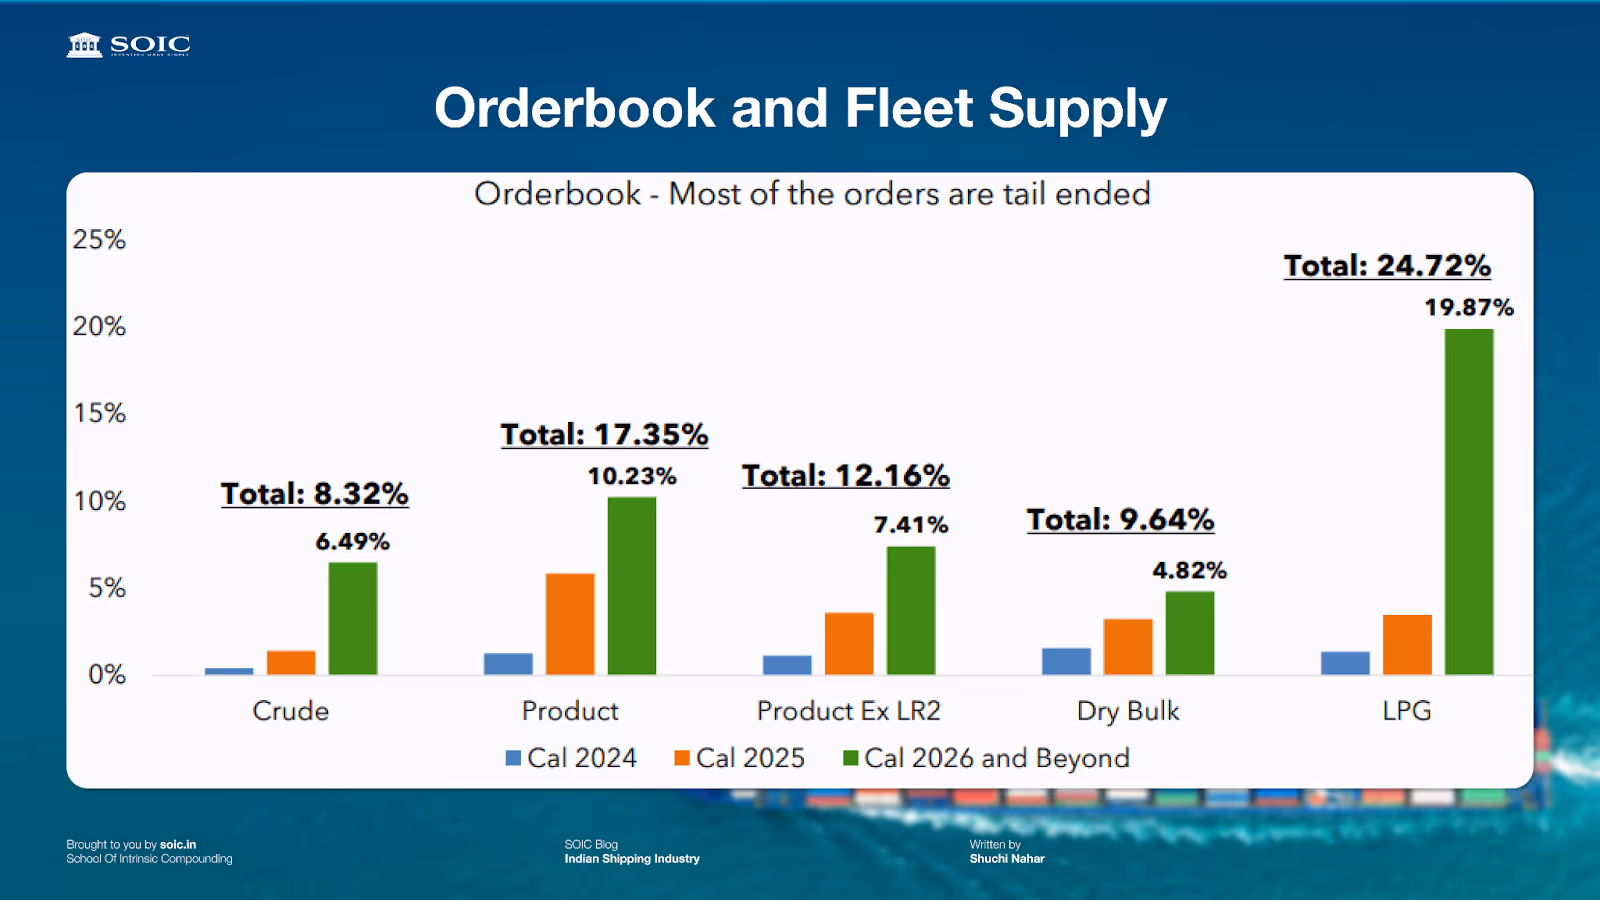
1. Order book and Fleet Supply:
The order book remains relatively low at 8% of the fleet for crude tankers and 17% for product tankers. However, the order book for LPG carriers is elevated at 24.7%, potentially leading to oversupply in this segment.
Aging fleets in the tanker segment could result in scrapping over the next few years, especially for vessels over 20 years old.
2. Geopolitical Factors:
Red Sea Conflict: Ongoing conflict has disrupted key shipping lanes, forcing vessels to reroute around the Cape of Good Hope. This has significantly boosted ton-mile demand for product tankers, supporting strong earnings.
Panama and Suez Canal Issues: While bottlenecks in the Panama and Suez Canals have eased, earlier disruptions contributed to higher freight rates due to extended voyage times.
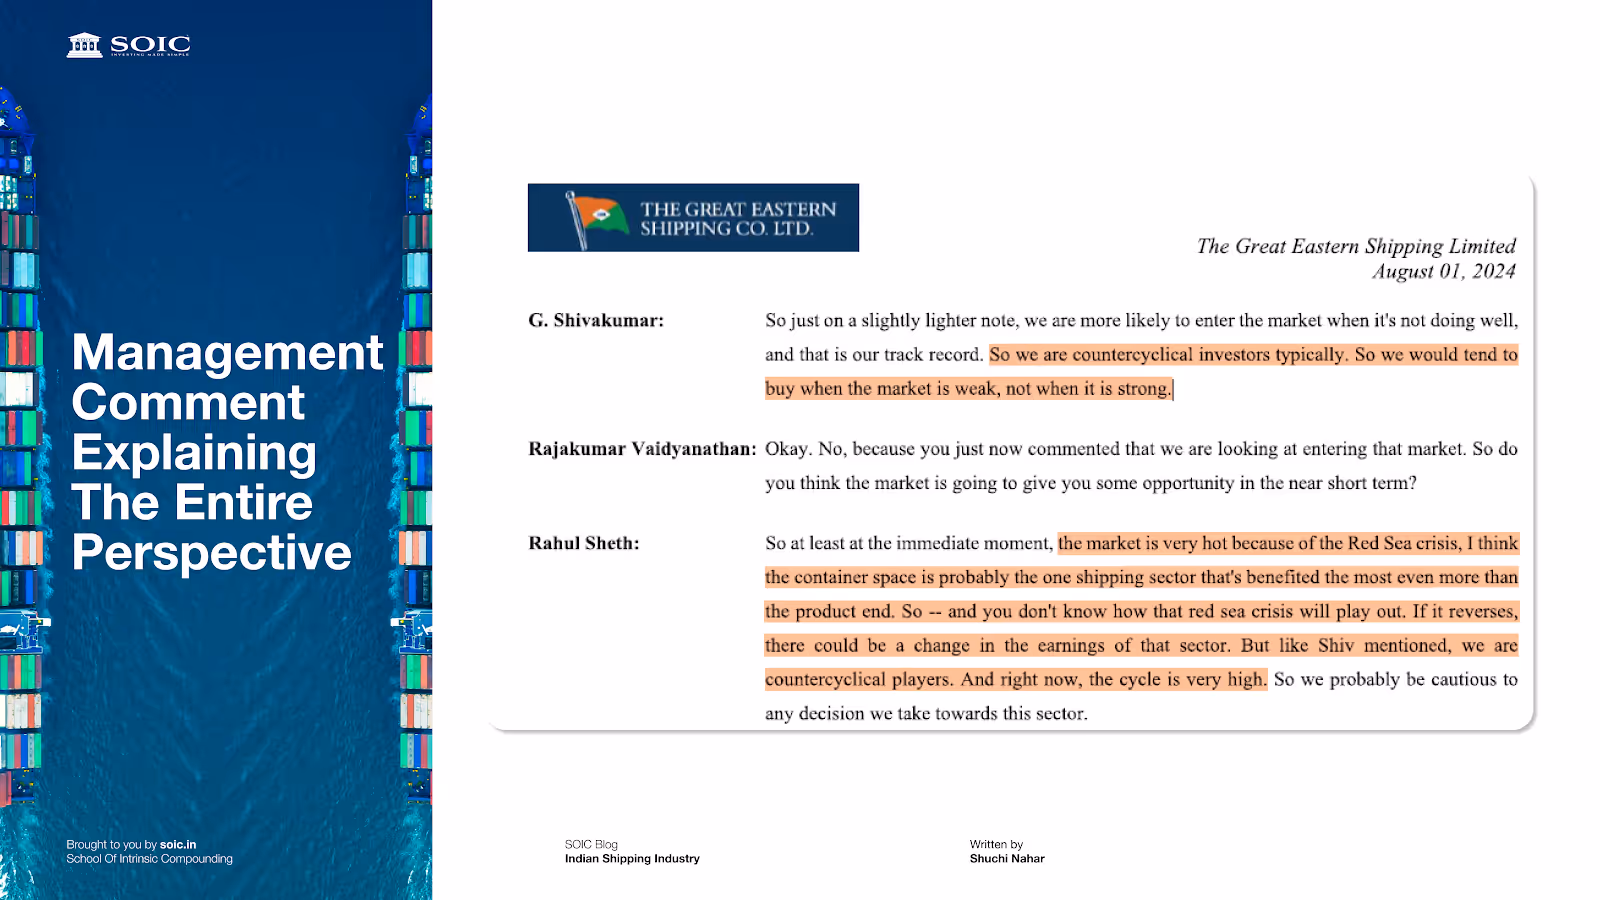
Management comment explaining the entire perspective
3. Freight Market Volatility:
Crude Tankers: Earnings for crude tankers declined by 13% QoQ to $46,352/day, largely due to softer Chinese crude imports.
Product Tankers: Despite the global slowdown, product tankers benefited from higher ton-mile demand due to geopolitical disruptions, with earnings up 12% YoY.
Dry Bulk: Strong iron ore and coal imports into China, coupled with high steel exports, pushed dry bulk earnings up 32% YoY.
4. Asset Prices and Scrapping:
Asset prices for LPG carriers and dry bulk vessels remain at record highs, making fleet expansion costly. However, low scrapping rates in recent years have allowed older ships to stay in the market longer.
Strategic Insights:
1. Cash Management and Deleveraging: GE Shipping has maintained a strong liquidity position, with ₹4,891 crores of cash and a net cash position of $350 million. This provides flexibility for counter-cyclical investments during market downturns.
2. Fleet Management: The company has a history of opportunistically trading vessels, allowing it to upgrade its fleet and capitalize on strong asset prices. It recently sold two older product tankers and committed to acquiring a newer one.
3. Offshore Business: With several rigs coming off contract, GE Shipping is exploring short-term opportunities. Six vessels have been repriced at higher rates, with 70% of offshore contracts covered for FY25.
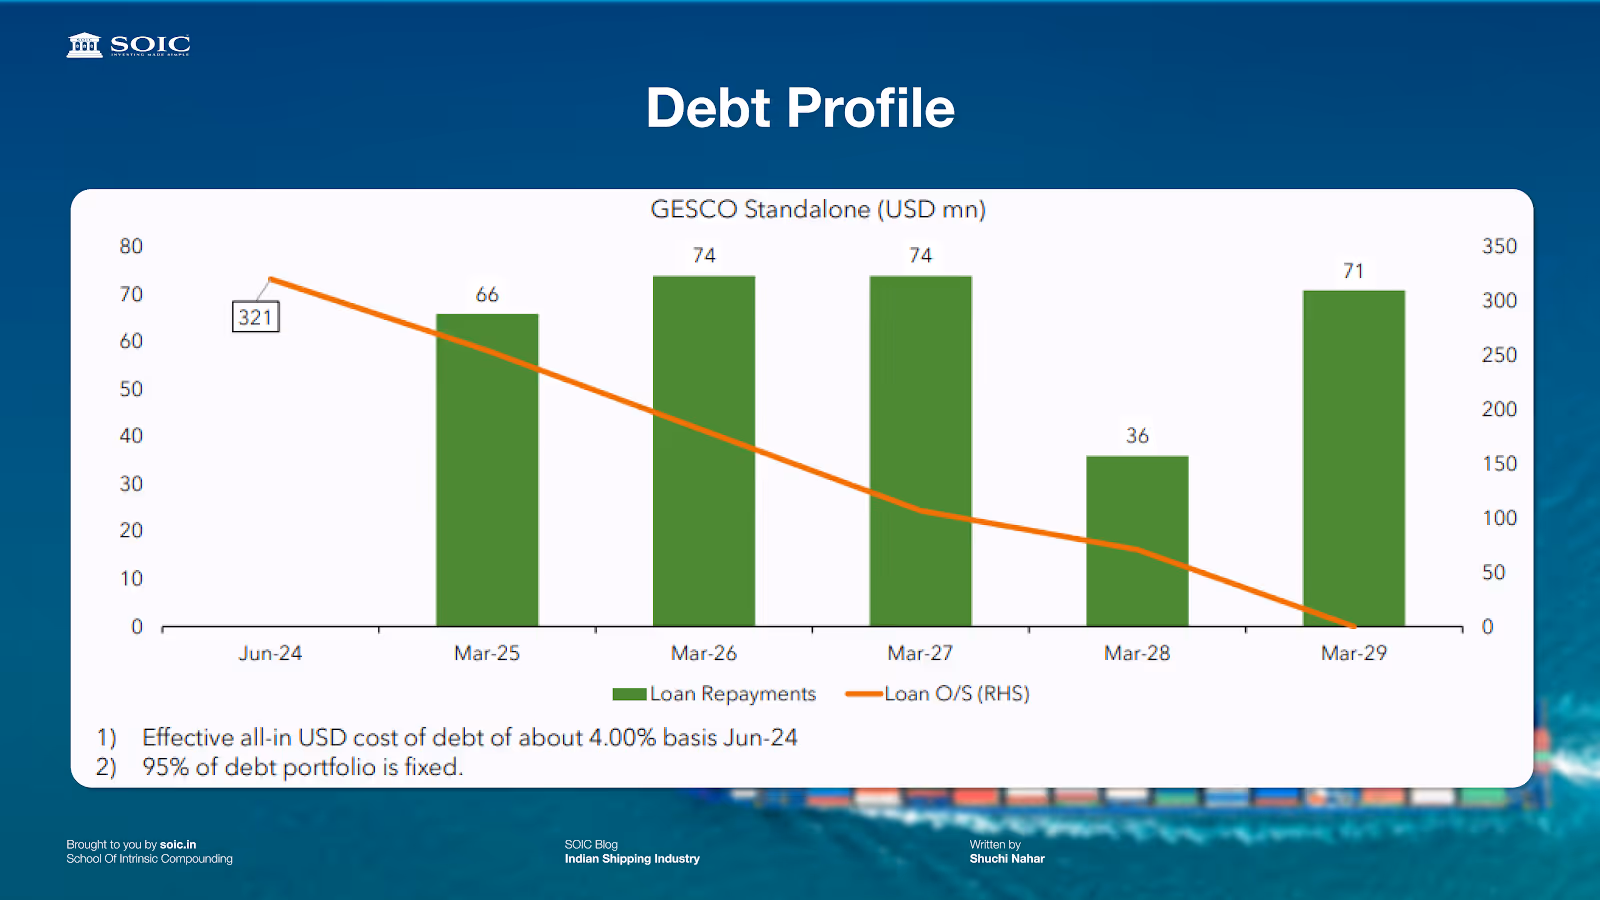
Debt profile: The debt repayment schedule for the Great Ship is very steady. Now they have done a refinancing of their debt, and this is to be paid over the next 3 to 4 years.
Risk Factors:
1. Market Volatility: The global shipping market is highly sensitive to geopolitical events, freight rate fluctuations, and trade patterns. Any resolution in the Red Sea conflict or a downturn in freight markets could negatively impact earnings.
2. High Asset Prices: The company faces challenges in expanding its fleet as asset prices remain elevated. Investing in new vessels during this high-rate market could limit future returns if rates drop.
3. Supply-Demand Imbalance: A higher order book for LPG carriers and delays in scrapping old vessels could lead to oversupply in certain segments, pressuring freight rates.
Conclusion:
GE Shipping remains a strong performer in the cyclical shipping industry, bolstered by prudent cash management, a young fleet, and strategic vessel trading. Despite strong recent financial performance, external risks such as geopolitical tensions and asset price volatility warrant cautious optimism. Investors should continue tracking global shipping dynamics, including fleet growth, scrapping potential, and order-book levels, to gauge the company’s long-term growth prospects.
The shipping sector plays a vital role in global trade and transportation. Companies in this sector benefit from the increasing global trade, technological advancements, and strong market demand.
As the world becomes more interconnected and the need for efficient shipping solutions grows, the sector remains robust. Investing in shipping stocks offers opportunities for stable returns and diversification. Here is the list that provides essential investment insights.
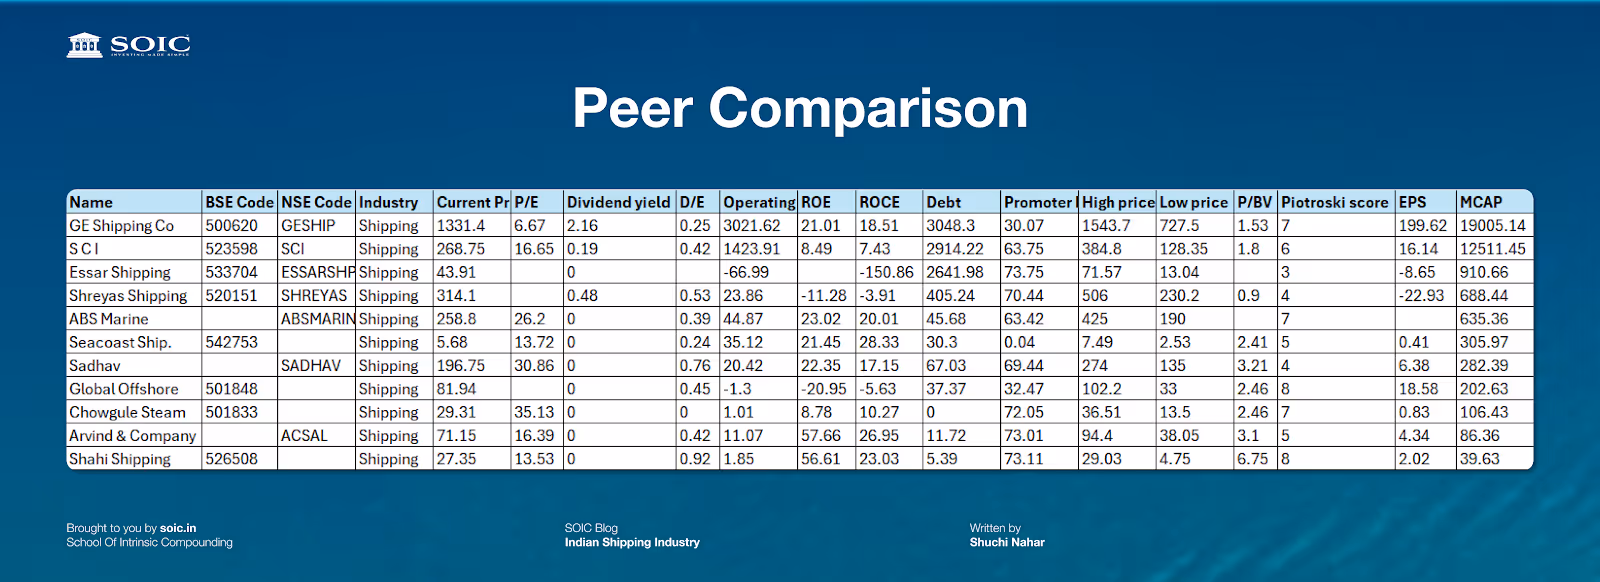
Peer Comparison
Here are some key valuation metrics that are commonly used:
1. Net Asset Value (NAV)
Description: NAV is the value of a company’s assets minus its liabilities. In the shipping industry, this typically includes the market value of the fleet (vessels) and any other assets like ports or terminals.
Usage: NAV is crucial for understanding the underlying value of a shipping company, especially during volatile market conditions. Investors often compare the company’s market capitalization to its NAV to assess if the stock is undervalued or overvalued.
2. Price to Net Asset Value (P/NAV)
Description: This ratio compares the company's market capitalization to its NAV.
Usage: A P/NAV below 1 suggests that the company is trading at a discount to its asset value, potentially making it an attractive investment. Conversely, a P/NAV above 1 may indicate that the company is trading at a premium.
3. EBITDA and EBITDA Margin
Description: EBITDA (Earnings Before Interest, Taxes, Depreciation, and Amortization) measures a company's operating profitability. The EBITDA margin is EBITDA as a percentage of revenue.
Usage: EBITDA provides insight into the core profitability of a shipping company, excluding non-operational costs. Higher EBITDA margins indicate better operational efficiency, which is important in the low-margin shipping industry.
4. Price to Earnings Ratio (P/E)
Description: The P/E ratio compares a company’s current share price to its earnings per share (EPS).
Usage: P/E ratios can be used to value shipping companies, though they should be interpreted cautiously due to earnings volatility. A low P/E might indicate an undervalued company, but in cyclical industries like shipping, it might also suggest that the market expects a downturn.
5. Enterprise Value to EBITDA (EV/EBITDA)
Description: EV/EBITDA is a measure of a company’s valuation, comparing its enterprise value (market cap + debt - cash) to its EBITDA.
Usage: This ratio is useful for comparing companies with different capital structures in the shipping industry. A lower EV/EBITDA ratio may indicate that a company is undervalued relative to its peers.
6. Time Charter Equivalent (TCE)
Description: TCE is a standard shipping industry metric that calculates daily earnings of a vessel after accounting for voyage expenses. It’s often used to compare different vessels or fleets.
Usage: TCE provides insight into how effectively a shipping company is utilizing its fleet. It is crucial for evaluating the operational efficiency and revenue potential of a shipping company.
7. Fleet Age and Composition
Description: The average age of the fleet and the types of vessels owned (e.g., tankers, bulk carriers, container ships).
Usage: Younger fleets with modern, fuel-efficient vessels tend to command higher valuations due to lower operating costs and higher future earnings potential. Investors may discount companies with older fleets due to higher maintenance costs and lower profitability.
8. Debt to Equity Ratio (D/E)
Description: This ratio measures a company’s financial leverage, calculated by dividing total debt by shareholders' equity.
Usage: The shipping industry is capital-intensive, often requiring significant debt. A high D/E ratio may indicate higher financial risk, especially in downturns. Conversely, a lower D/E suggests a more conservative financial structure, potentially reducing risk during market volatility.
9. Free Cash Flow (FCF)
Description: FCF represents the cash a company generates after accounting for capital expenditures (CapEx).
Usage: Positive free cash flow is essential for a shipping company’s sustainability, especially in down cycles. FCF can be used to pay down debt, reinvest in the business, or return capital to shareholders.
10. Return on Invested Capital (ROIC)
Description: ROIC measures how effectively a company is using its capital to generate returns, calculated by dividing net operating profit after taxes (NOPAT) by invested capital.
Usage: A higher ROIC indicates better capital efficiency, crucial for companies in the capital-intensive shipping industry. Investors look for companies that consistently generate returns above their cost of capital.
11. Operating Days and Utilisation Rates
Description: Operating days refer to the number of days a vessel is actively earning revenue, while utilization rates measure how effectively the fleet is being used.
Usage: Higher operating days and utilisation rates directly translate to better revenue generation, making these metrics important for assessing a shipping company’s operational efficiency.
12. Break-Even Rates
Description: The break-even rate is the minimum daily rate a shipping company needs to cover its operating expenses, including financing costs.
Usage: Understanding a company's break-even rate helps investors assess its ability to remain profitable during market downturns. Companies with lower break-even rates are better positioned to survive in low-rate environments.
Valuation in the shipping industry requires a combination of asset-based metrics (like NAV and fleet age) and performance-based metrics (like EBITDA and TCE). Investors must also consider the cyclical nature of the industry, using these metrics to assess both current performance and future potential in various market conditions.
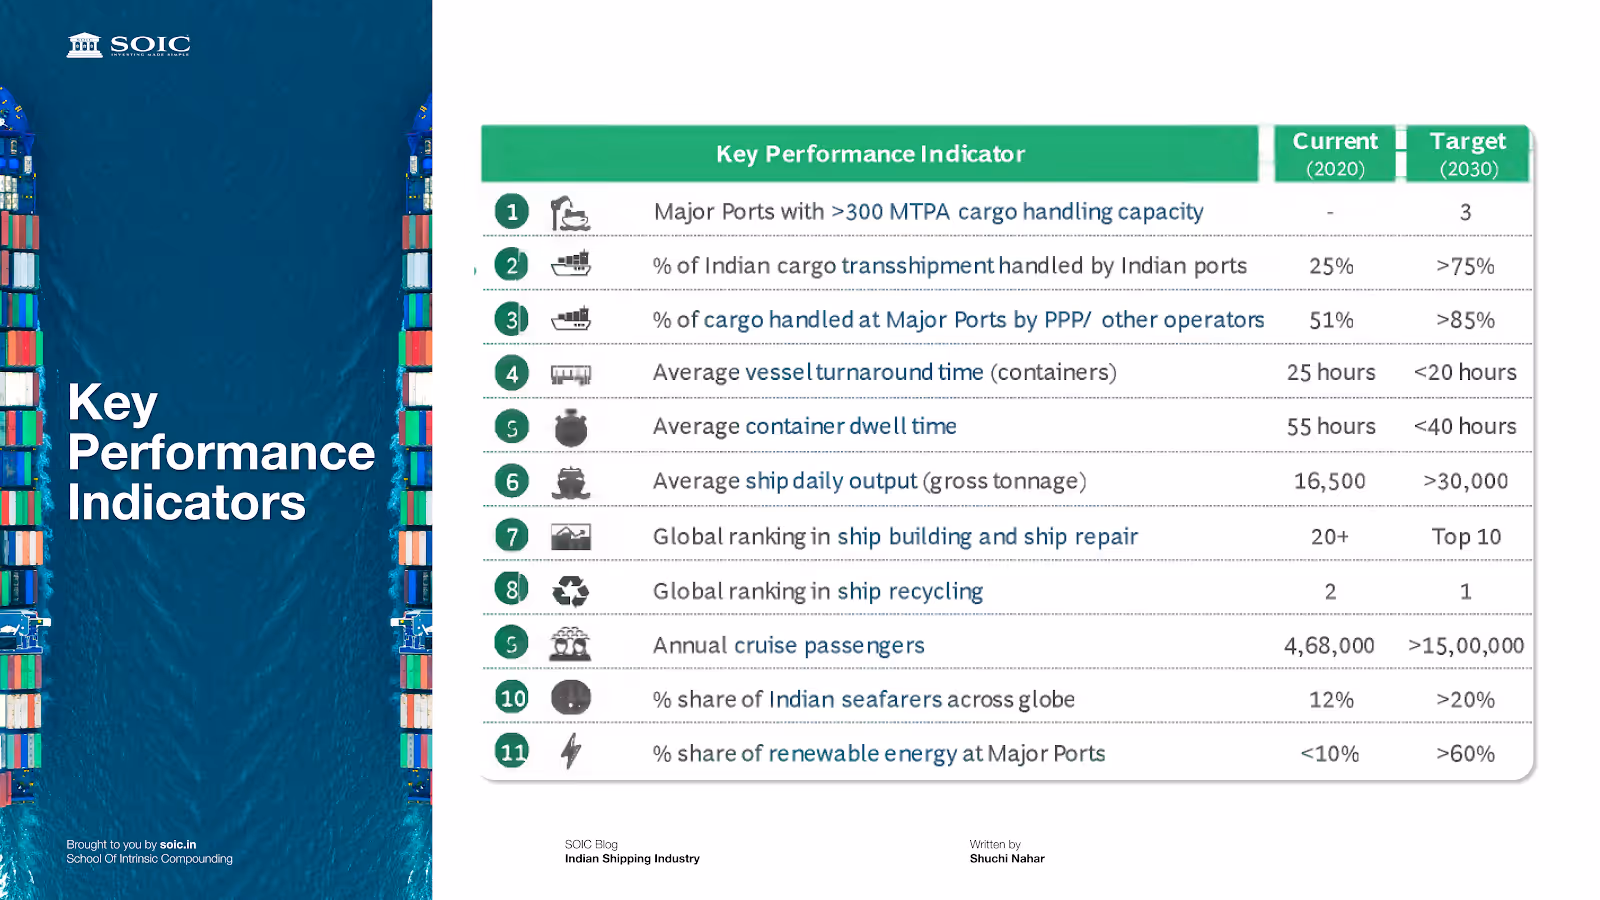
Key Performance Indicators
Here, let's discuss a few KPIs.
Freight Rates: Freight rates are the prices charged for transporting goods and are a critical KPI for shipping companies. Rates fluctuate based on supply and demand dynamics and are measured using indices such as the Baltic Dry Index (BDI) for bulk carriers and the Shanghai Containerised Freight Index (SCFI) for container ships.
Fleet Utilisation Rate: The fleet utilisation rate measures the percentage of a shipping company's fleet that is actively engaged in transporting goods. Higher utilisation rates indicate better asset management and revenue generation.
Operating Costs: Operating costs, including fuel, crew wages, maintenance, and insurance, are significant components of a shipping company's expenses. Monitoring these costs is crucial for maintaining profitability, especially in a highly competitive market.
Time Charter Equivalent (TCE): TCE is a measure of the daily revenue generated by a vessel, calculated by dividing voyage revenues by the number of voyage days. It is a crucial KPI for comparing the performance of vessels across different routes and time periods.
Orderbook-to-Fleet Ratio: This ratio compares the number of ships on order to the current fleet size. A high ratio indicates potential future supply growth, which could impact freight rates if demand does not keep pace.
To conclude, we can analyse that India’s maritime sector presents a vibrant landscape for investment, supported by progressive government policies, robust infrastructure development plans, and an increasing focus on public-private partnerships.
The ongoing initiatives and policy reforms are not only making the sector more competitive but also positioning India as a pivotal maritime hub in the global economy. Investors, both domestic and international, have ample opportunities to participate in and benefit from the growth of India’s maritime industry.
This momentum is expected to continue, especially with ongoing projects and new initiatives under the Sagarmala Program and Vision India 2030.
Disclaimer:The information provided in this reference is for educational purposes only and should not be considered investment advice or a recommendation. As an educational organizsation, our objective is to provide general knowledge and understanding of investment concepts. We are SEBI-registered research analysts.
It is recommended that you conduct your own research and analysis before making any investment decisions. We believe that investment decisions should be based on personal conviction and not borrowed from external sources. Therefore, we do not assume any liability or responsibility for any investment decisions made based on the information provided in this reference.
Industry Trends
Sector Analysis
Market Trends
Author
Shuchi Nahar
Masters in Finance with 5 years of industry experience. My approach is to take one sector at a time and explore plausible Investment ideas.

.avif)


.avif)

0 Comments