
Looks can be deceptive :). So too can be PE ratios of different businesses. PE ratio isn’t valuation but a short cut of understanding the multiple that a company trades at.
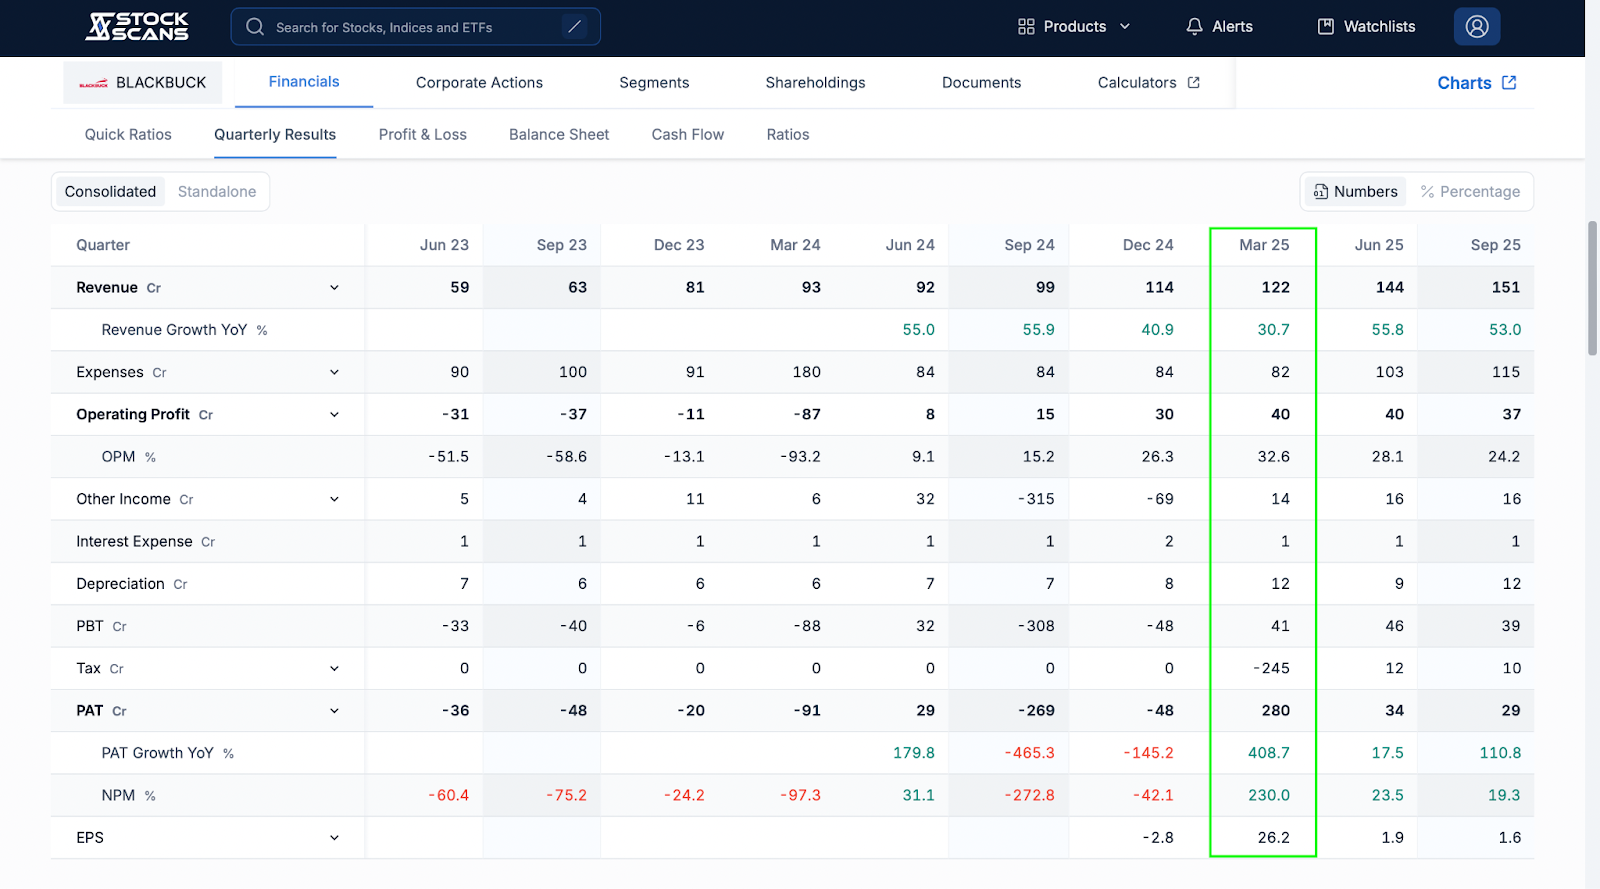
Above is an example of a Blackbuck where PE ratio is 30 times. 30 times profits for a new age trucking tolling business that is growing fast seems cheap right?
Don’t get too ahead 🙂. This is where the PE ratio can come and fool you.
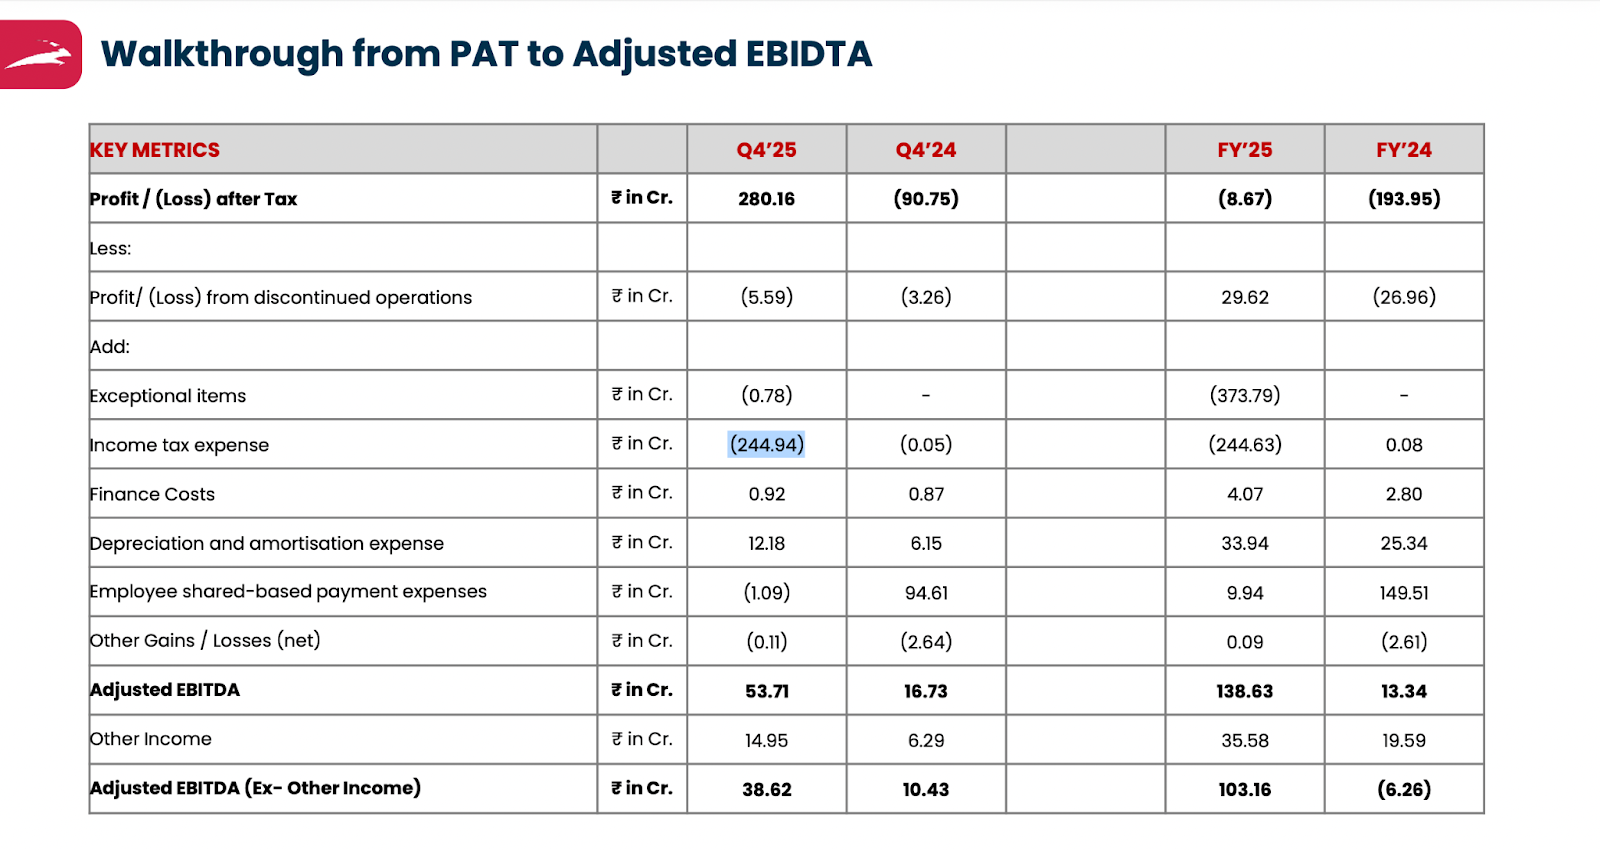
In Q4FY25 results, there was a one off in the results of Blackbuck. There was an income tax Write back of 245 crores, and adjusted for that the PAT of the company would have been close to 30-32 crores.
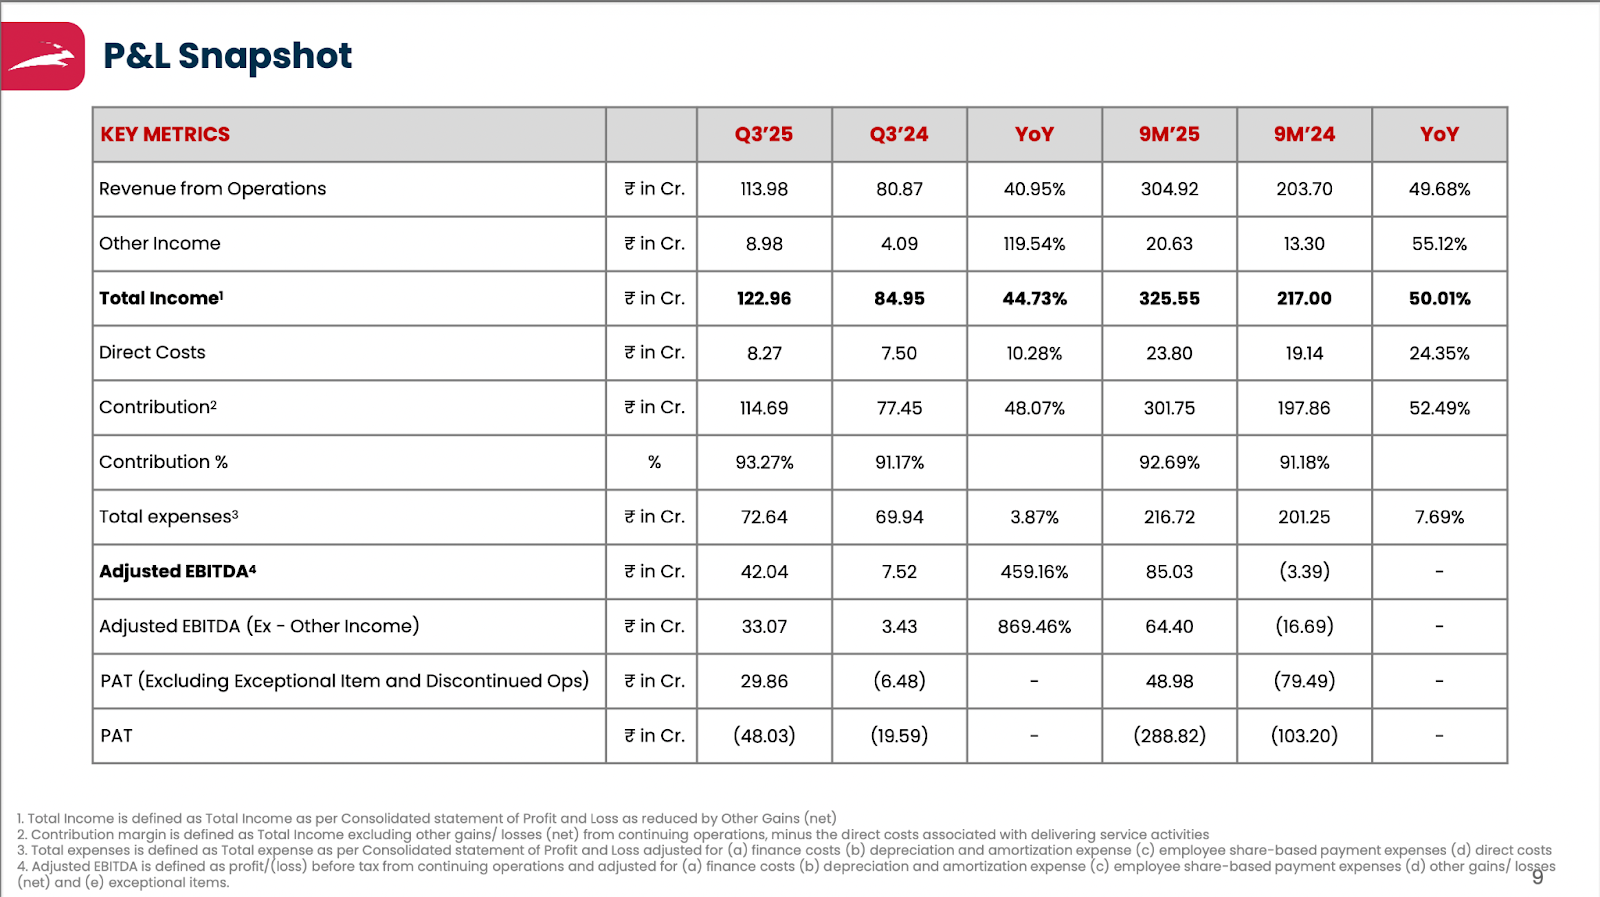
Now, even for Q3FY25 there was a one off in PAT as the losses from discontinued business which is a non cash expense were still showing up in the income statement. Adjusted PAT was close to 30 crores. Here is the snapshot of the same
Now, lets calculate the Real PE of Zinka assuming the PAT adjusted for all one offs in last 4 Quarters
Q2FY26 PAT: 31 crores
Q1FY26 PAT: 35 crores
Q4FY25 PAT: 31 crores
Q3FY25 PAT: 30 crores
TTM PAT: 127 crores.
Market Cap of Zinka: 11,431 crores
True core PAT PE adjusted for one offs= 11,431/127=90 times
Here is a key lesson when it comes to PE ratios. Always follow these learnings
1. Always adjust for one offs which distort the PE ratio. There could be one off losses too which won’t repeat.
2. A very low PE ratio like in the case of Rain industries can be misleading as many industries are cyclical.
3. In Industries like Banking, Insurance, or Real estate. PE ratio can be a misleading metric. Given other valuation parameters like Price to book, Embedded value and Pre sales can be used.
Here is an example of valuation ratios you can use across sectors

4. In very high growth rate stories, sometimes the TTM PE ratio can be misleading and one needs to look at the Forward PE vs the EPS growth rates.
5. Use PEG ratio to your advantage :) PEG= PE/EPS growth rates. Look at the forward growth rate of the business, and typically a PEG of lower than 1.5 times signifies that you are not paying too much for the stock.
6. There is no use of valuing a company either on PE or DCF in a dying industry. Eg:- Reason why newspaper or FM radio stocks trade in low single digit PE.
Finally, learn to bifurcate the PE ratio between Perception/Earnings. This is how PE ratios can be truly decoded.
Perception= Study of sentiments, liquidity, interest rates, macro stability, industry tailwinds or headwinds, oversupply or more demand.
Earnings= study of growth triggers, and how fast the company can grow.

+Here is a free masterclass you can watch to understand PE ratios
Do let me know in the comment section below if you loved this blog :). We value your feedback and I hope that I keep writing these blogs to teach you more about investing. I am also doing a class on the TVGP checklist of investing this Sunday at 1pm. You can register for it here : https://learn.soic.in/learn/fast-checkout/250538?priceId=233099


.avif)
0 Comments